


Introduction
Ten years ago, I stumbled upon something that genuinely blew my mind. It was Conky, running on my Linux desktop, and I was absolutely amazed. Imagine a real-time dashboard of your system’s resources, seamlessly integrated into your wallpaper, updating right before your eyes. CPU usage, RAM consumption, network traffic – it was all there, a living, breathing testament to the power of open-source customization. Back then, it was mostly about aesthetics for me, a way to make my desktop look incredibly cool. But as I grew into a seasoned security researcher, Conky evolved from a visual novelty into a surprisingly powerful, immediate security indicator.
Brief History of Widgets
Conky predates the desktop widgets introduced in Windows Vista and Windows 7.
Here’s a quick timeline:
– Conky: Conky itself is a fork of an even older system monitor called Torsmo. Conky was first released around 2004.
– Windows Vista: Microsoft’s Windows Vista, which introduced the “Windows Sidebar” and its gadgets (widgets), was generally available on January 30, 2007.
– Windows 7: Windows 7, which continued with desktop gadgets, was generally available on October 22, 2009.
So, Conky was already a well-established and popular system monitoring tool in the Linux community for a few years before Windows Vista brought desktop widgets to the mainstream Windows user base. The concept of having live system information directly on the desktop was certainly present and highly customizable in the open-source Linux world before it became a feature in Windows.
The Lightweight, Live System Dashboard
At its core, Conky is a free, lightweight system monitor for the X Window System. It’s renowned for its minimal resource footprint, which means it can run constantly without bogging down your machine. What makes Conky truly special is its incredible configurability. Everything you see—from the font and color to the data displayed and its layout—is controlled by a simple text file (.conkyrc) and can be extended with Lua scripting.
Conky can display a vast array of system information:
- CPU Usage: Per-core or overall.
- Memory & Swap: Current usage, free, and total.
- Disk I/O: Read/write speeds for specific drives or partitions.
- Network Traffic: Upload/download speeds, total data transferred, and local/public IP addresses.
- Running Processes: Top CPU or memory consumers.
- System Temperatures: CPU, GPU, and disk temperatures.
- Uptime & Kernel Information: How long your system has been running and its kernel version.
- Battery Status: Percentage and charging status.
This level of detail, presented live on your desktop, is where its true value begins to shine for someone with a security-focused mindset.
Beyond Eye Candy: Conky as a First-Line Security Indicator
For a security researcher, Conky isn’t just a pretty face; it’s a constant, passive monitor that can often provide the very first hint of something amiss. It acts as a “heads-up display” for unusual system activity.
- The “Unusual Activity” Detector:
- CPU/RAM Spikes: Have you ever seen your CPU jump to 80% or your RAM suddenly fill up when you’re just browsing the web or the system should be idle? Conky makes this immediately obvious. Such unexplained spikes can be a red flag for unexpected processes, cryptominers running in the background, or even early-stage malware activity.
- Network Outliers: A sudden, sustained outbound connection or an unusual burst of data transfer, especially when you’re not actively downloading or uploading, could indicate data exfiltration, command-and-control (C2) communication with a malicious server, or even a system being used as part of a botnet. Conky’s network graphs make these anomalies visually striking.
- Disk I/O Anomalies: If your disk is thrashing with excessive read/write operations when you’re not actively using it, it might hint at ransomware encrypting files, data being staged for exfiltration, or unauthorized file access.
- Process Vigilance: Conky can show you the top processes consuming resources. If you suddenly see an unfamiliar process with a strange name consuming significant CPU or memory, it’s an immediate prompt to investigate further using tools like
htoporps aux. - Complementing Traditional Tools: Conky doesn’t replace your sophisticated SIEM (Security Information and Event Management) systems, IDS/IPS (Intrusion Detection/Prevention Systems), or deep forensic tools. Instead, it complements them. It provides the immediate visual cues that can save you valuable time, prompting you to dive deeper with your more robust analysis tools. It’s the “canary in the coal mine” for your desktop.
Practical Conky Configurations for the Security-Minded
To leverage Conky for security, you’ll want to prioritize certain metrics in your configuration:
- CPU and Memory Usage: Always keep an eye on
cpuandmempercwith their corresponding bars (cpubar,membar). - Network Activity:
upspeed,downspeed,totalup,totaldown, and their respective graphs (upspeedgraph,downspeedgraph) are critical. Consider monitoring specific interfaces. - Top Processes: The
topobject (e.g.,${top name 1},${top cpu 1}%) is invaluable for quickly spotting resource hogs. - Disk I/O:
diskio_readanddiskio_writefor your primary drives can highlight suspicious disk activity. - Custom Scripting for Deeper Insight: Conky’s
execandexeci(execute interval) commands are powerful. You can use them to run small shell scripts that pull very specific security-relevant data. For example, you could display:- The number of failed SSH login attempts from
/var/log/auth.log. - A count of active network connections to unusual ports.
- The status of your firewall.
- Checksums of critical system files (though this would be resource-intensive for real-time).
- The number of failed SSH login attempts from
- Visual Cues: Don’t underestimate the power of color and graph changes. Use contrasting colors for high usage or critical alerts to make anomalies jump out instantly.
Simple Demo
-- Conky Script 1: System Stats Focused

conky.config = {
    alignment = 'top_right',
    background = true,
    border_width = 1,
    cpu_avg_samples = 2,
    default_color = 'white',
    default_outline_color = 'white',
    default_shade_color = 'white',
    draw_borders = false,
    draw_graph_borders = false,
    draw_outline = false,
    draw_shades = false,
    use_xft = true,
    font = 'FiraCode Nerd Font:size=12', -- Increased by 20%
    gap_x = 15,
    gap_y = 30,
    minimum_width = 250,
    maximum_width = 250,
    net_avg_samples = 2,
    no_buffers = true,
    out_to_console = false,
    out_to_stderr = false,
    extra_newline = false,
    own_window = true,
    own_window_class = 'Conky',
    own_window_type = 'desktop', -- Use 'desktop' for XFCE, 'override' for Openbox
    -- For true transparency with a compositor (e.g. picom)
    own_window_transparent = false,
    own_window_argb_visual = true,
    own_window_argb_value = 0, -- 0=transparent, 255=opaque
    own_window_hints = 'undecorated,below,sticky,skip_taskbar,skip_pager',
    stippled_borders = 8,
    update_interval = 1.0,
    uppercase = false,
    use_spacer = 'none',
    show_graph_range = false,
    show_graph_scale = false,
    text_buffer_size = 2048,
    double_buffer = true,
    border_inner_margin = 0,
    border_outer_margin = 0,
}

conky.text = [[
${color #FFD700}${font Sans:size=48}${time %H:%M}${font}
${color #ADD8E6}${font Sans:size=18}${time %A, %B %d}${font}

${color grey}SYSTEM ${hr 2}
${color}Uptime: ${uptime}
${color}Kernel: ${kernel}
${color}CPU: ${cpu cpu0}% ${cpubar cpu0 8}
${color}Temperatures: CPU: ${hwmon 5 temp 1}°C  GPU: ${hwmon 3 temp 1}°C
${color}Cores:
${color} C1: ${cpu cpu1}% ${cpubar cpu1 4}  C5: ${cpu cpu5}% ${cpubar cpu5 4}
${color} C2: ${cpu cpu2}% ${cpubar cpu2 4}  C6: ${cpu cpu6}% ${cpubar cpu6 4}
${color} C3: ${cpu cpu3}% ${cpubar cpu3 4}  C7: ${cpu cpu7}% ${cpubar cpu7 4}
${color} C4: ${cpu cpu4}% ${cpubar cpu4 4}  C8: ${cpu cpu8}% ${cpubar cpu8 4}
${color}RAM: $memperc% ${membar 8}
${color}Swap: $swapperc% ${swapbar 8}
${color}Processes: ${running_processes}/${processes}
${color}Battery: ${battery_percent BAT1}%

${color grey}STORAGE ${hr 2}
${color}/: ${fs_used /}/${fs_size /} ${fs_bar 8 /}
${color}/home: ${fs_used /home}/${fs_size /home} ${fs_bar 8 /home}

${color grey}NETWORK (wlo1) ${hr 2}
${color}Local IP: ${addr wlo1}
${color}Public IP: ${execi 300 curl -s ifconfig.me}
${color}Up: ${upspeed wlo1} / Down: ${downspeed wlo1}
${color}Total Up: ${totalup wlo1} / Down: ${totaldown wlo1}
${color}Upload:   ${upspeedgraph wlo1 25,120 0000FF FF0000}
${color}Download: ${downspeedgraph wlo1 25,120 0000FF FF0000}

${color grey}TOP PROCESSES (CPU) ${hr 2}
${color}${top name 1} ${top cpu 1}%
${color}${top name 2} ${top cpu 2}%
${color}${top name 3} ${top cpu 3}%
${color}${top name 4} ${top cpu 4}%
${color}${top name 5} ${top cpu 5}%
${color}${top name 6} ${top cpu 6}%
${color}${top name 7} ${top cpu 7}%
${color}${top name 8} ${top cpu 8}%
${color}${top name 9} ${top cpu 9}%
${color}${top name 10} ${top cpu 10}%
]]
To use these scripts:
- Save: Copy and paste into your text (
nanoorvim) editor then save it as a file, for example,~/.conkyrc. - Edit Network Interface: In the scripts, I’ve used
enp0s3as the network interface. You might need to change this to your actual network interface name (e.g.,eth0,wlan0,enp1s0). You can find your interface name usingip ain your terminal. - Run: Open a terminal and run
conky -c ~/.conkyrc.- Installation Note: If you don’t have Conky installed, run the appropriate command for your distribution:
- Debian/Ubuntu:
sudo apt install conkyfor Fedora/CentOS:sudo dnf install conky
- Autostart (Openbox): To make Conky start automatically with Openbox, add
(sleep 2s && conky -c ~/.conkyrc &)to your~/.config/openbox/autostartfile. Thesleep 2shelps ensure Conky starts after your desktop environment is fully loaded. - Autostart (XFCE4): via menu: Settings Manager → Session and Startup → Application Autostart.
Click Add → Name:Conkythen command:conky -p 5 -c /home/<your user>/.conkyrc
Note: Recently, I switch to Openbox Linux Desktop as lightweight Linux DE, for other DE such as Gnome, KDE, Cinamon, LXDE just google it for autostart configuration.
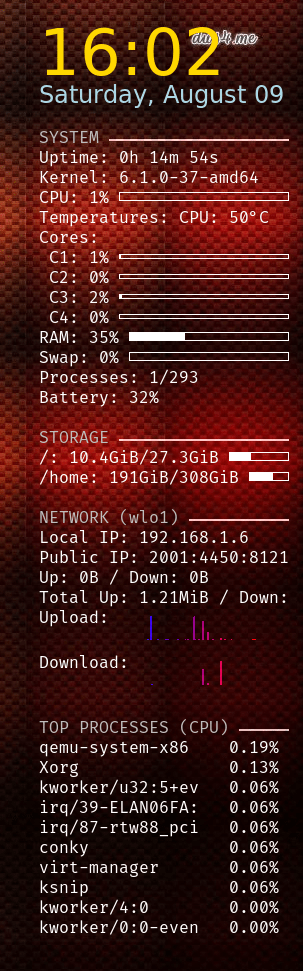
Here’s the script in action! If you’re curious about other Conky designs, Google is your friend—there are tons of creative desktop setups and design inspirations out there.
Conky’s Limitations in Security
It’s crucial to understand what Conky is not. It’s not a silver bullet, nor is it a replacement for dedicated security solutions:
- Not an EDR/SIEM: Conky doesn’t perform deep log analysis, correlate events across multiple systems, or provide historical data for complex forensic investigations. It’s a snapshot, not a comprehensive record.
- No Prevention: Conky is a monitoring tool. It will alert you to potential issues, but it won’t prevent an attack from happening.
- Data Source Dependent: Its accuracy and usefulness are limited by the data your underlying operating system makes available through
/proc,/sys, and other system utilities. It doesn’t have its own sensors or advanced detection capabilities.
Some FAQs
1. Does conky keep data for persistence? NO, Conky’s primary function is to display real-time data on your desktop. It’s designed to be a live, constantly updating visual monitor.
2. Does conky available in MacOs or Windows OS? NO, Conky is designed to run on virtually any Linux Desktop Environment (DE). It’s a standalone system monitor that draws directly onto the X Window System (Xorg)
Final Thoughts
My decade-long journey with Conky has shown me that even seemingly simple tools can have profound implications when viewed through a different lens. What started as a cool way to display system stats evolved into an essential part of my immediate security awareness. It puts crucial, real-time information directly on my desktop, fostering a proactive security mindset by making anomalies visually undeniable.
If you’re a Linux user, especially one with an interest in system security, I highly encourage you to explore Conky. Customize it, experiment with its exec commands to pull security-relevant data, and discover how this humble desktop sentinel can empower you to spot the unusual and act quickly.