
Why This Script Exists
You've got Prometheus, Grafana, Loki, and Alertmanager running. Dashboards look beautiful. Alerts fire when thresholds are breached. So why do you need a health check email?
Because dashboards are reactive.
Health checks are proactive. They give you a snapshot of everything — CPU, memory, disk, Docker containers, failed systemd units, SSH brute force attempts — in one HTML email that lands in your inbox. No login required. No clicking through panels. Just a subject line that says "All Good" or screams "Something's Wrong."
I built healthcheck.sh as a lightweight, standalone alternative to full monitoring stacks. It's one bash script, runs via cron, sends a nicely formatted email report. Perfect for when you want to know your VPS is alive without opening a browser.
Here's what we'll cover:
- What metrics the script collects
- The full code walkthrough
- How to set it up and customize it
What the Script Monitors
The script collects 15+ categories of system metrics:
| Category | What It Checks | Thresholds |
|---|---|---|
| CPU | Usage %, user/system split, I/O wait | 70% warn, 90% critical |
| Memory | Total/used/available, swap usage | 75% warn, 90% critical |
| Disk | Root partition usage, inode usage | 75% warn, 90% critical |
| Network | RX/TX bytes, errors, drops | Any error = critical |
| Docker | Running/stopped containers, healthy/unhealthy | Any unhealthy = critical |
| Systemd | Failed services count + names | Any failure = critical |
| Processes | Total count, zombie processes | Any zombie = critical |
| Top Consumers | Top 5 CPU and memory consumers | Informational |
| Security | SSH failed attempts (24h), OOM kills | 10 warn, 50 critical |
| System | Hostname, OS, kernel, uptime, load | Informational |
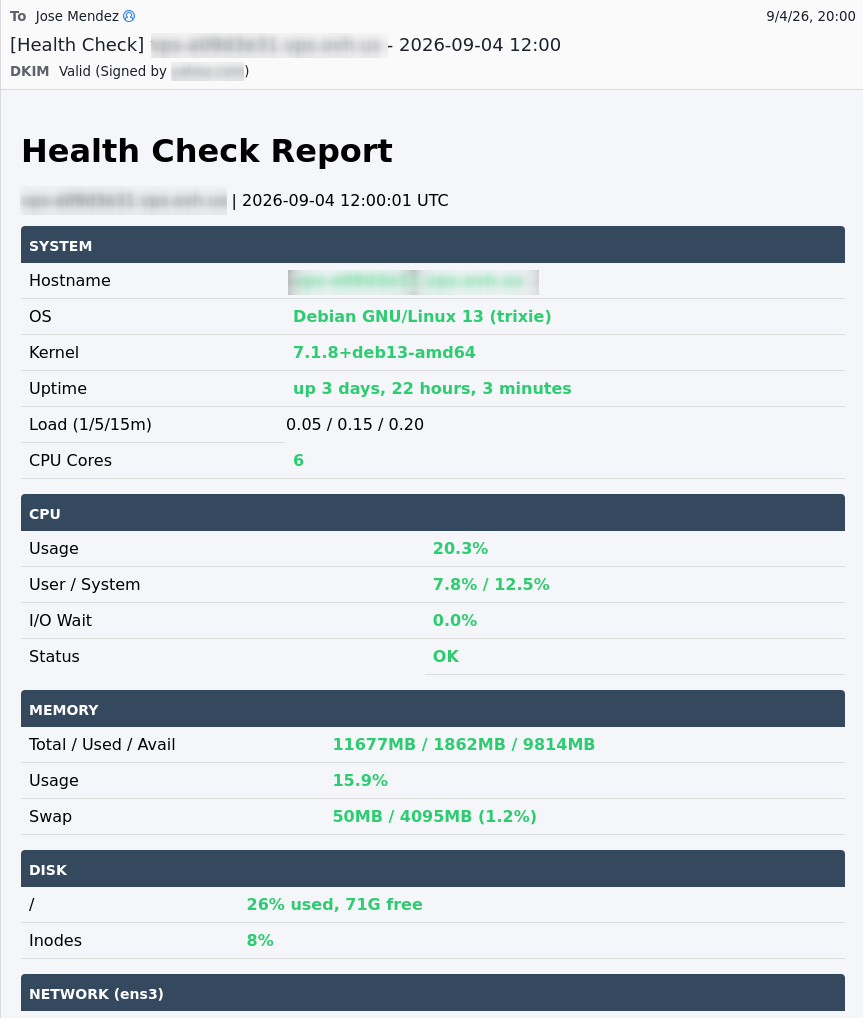
Each metric gets color-coded (green/yellow/red) in the email, so you can scan the report in 2 seconds and know if anything needs attention.
Code Walkthrough
Let's break down the script section by section.
Configuration and Setup
#!/bin/bash
# Health Check Monitoring Script
# Sends HTML email report via smtp-relay:587

set -euo pipefail

# --- Configuration ---
SMTP_HOST="172.19.0.9"
SMTP_PORT="587"
FROM="[email protected]"
TO="[email protected]"
MY_HOSTNAME=$(hostname -f)
REPORT_DATE=$(date '+%Y-%m-%d %H:%M:%S %Z')
Standard bash setup with set -euo pipefail for safety. Configuration block at the top — change SMTP_HOST, FROM, and TO for your setup. The SMTP host is a local Docker container (smtp-relay), not a remote server.
Helper Functions
# --- Color Codes ---
GREEN="#2ecc71"
YELLOW="#f39c12"
RED="#e74c3c"
GRAY="#95a5a6"

pct_color() {
    local val=$1 warn=$2 crit=$3
    awk "BEGIN{v=$val; w=$warn; c=$crit; if(v>c) print \"$RED\"; else if(v>w) print \"$YELLOW\"; else print \"$GREEN\"}"
}

pct_status() {
    local val=$1 warn=$2 crit=$3
    awk "BEGIN{v=$val; w=$warn; c=$crit; if(v>c) print \"CRITICAL\"; else if(v>w) print \"WARNING\"; else print \"OK\"}"
}

bytes_human() {
    local b=$1
    awk "BEGIN{b=$b; if(b>1073741824) printf \"%.2f GB\",b/1073741824; else if(b>1048576) printf \"%.2f MB\",b/1048576; else if(b>1024) printf \"%.2f KB\",b/1024; else print b\" B\"}"
}
Three utility functions that do the heavy lifting:
pct_color— returns HTML color based on value against warning/critical thresholdspct_status— returns status string ("OK", "WARNING", "CRITICAL")bytes_human— converts raw bytes to human-readable format (KB/MB/GB)
row() {
    echo "<tr><td style='padding:8px;border-bottom:1px solid #ddd;'>$1</td><td style='padding:8px;border-bottom:1px solid #ddd;color:${3:-$GREEN};font-weight:bold;'>$2</td></tr>"
}

section() {
    echo "<tr><td colspan='2' style='padding:12px 8px 8px;background:#34495e;color:white;font-weight:bold;font-size:14px;border-radius:4px 4px 0 0;'>$1</td></tr>"
}
HTML table helpers. row() creates a two-column table row with optional color. section() creates a dark header row for each category.
Metric Collection
# System
UPTIME_STR=$(uptime -p 2>/dev/null || uptime)
LOAD_STR=$(cat /proc/loadavg | awk '{print $1" / "$2" / "$3}')
CORES=$(nproc)
KERNEL=$(uname -r)
OS=$(grep PRETTY_NAME /etc/os-release | cut -d'"' -f2)
Basic system info. The || uptime fallback handles systems where uptime -p isn't available.
# CPU
read CPU_USER CPU_SYS CPU_IDLE CPU_IOW <<< $(top -bn1 | grep "%Cpu" | sed 's/%Cpu(s)://' | awk '{
    for(i=1;i<=NF;i++){
        gsub(/,/,"",$i)
        if($i=="us")u=$(i-1)
        if($i=="sy")s=$(i-1)
        if($i=="id")d=$(i-1)
        if($i=="wa")w=$(i-1)
    }
    printf "%s %s %s %s",u,s,d,w
}')
CPU_USED=$(awk "BEGIN{printf \"%.1f\",100-${CPU_IDLE:-0}}")
CPU metrics parsed from top output. This is more reliable than parsing /proc/stat directly.
# Memory
MEM_TOTAL=$(free -m | awk '/Mem:/{print $2}')
MEM_USED=$(free -m | awk '/Mem:/{print $3}')
MEM_AVAIL=$(free -m | awk '/Mem:/{print $7}')
MEM_PCT=$(awk "BEGIN{printf \"%.1f\",$MEM_USED*100/$MEM_TOTAL}")
Memory stats from free. Uses available memory (not just free) for more accurate reporting.
# Disk
DISK_USED_PCT=$(df / | tail -1 | awk '{gsub(/%/,"",$5); print $5}')
DISK_AVAIL=$(df -h / | tail -1 | awk '{print $4}')

# Inodes
INODE_USED_PCT=$(df -i / | tail -1 | awk '{gsub(/%/,"",$5); print $5}')
Disk and inode usage. Inodes are often overlooked — you can run out of inodes before running out of disk space.
# Network
NET_RX=$(ip -s link show ens3 2>/dev/null | awk '/RX:/{getline; print $1}' || echo "0")
NET_TX=$(ip -s link show ens3 2>/dev/null | awk '/TX:/{getline; print $1}' || echo "0")
NET_ERRORS=$(ip -s link show ens3 2>/dev/null | awk '/RX:/{getline; print $3}' || echo "0")
NET_DROPS=$(ip -s link show ens3 2>/dev/null | awk '/RX:/{getline; print $5}' || echo "0")
Network stats from ip. Note the interface is hardcoded to ens3 — change this to match your network interface (ip link show to find yours).
# Docker
if command -v docker &>/dev/null; then
    DOCKER_RUNNING=$(docker ps 2>/dev/null | tail -n +2 | wc -l)
    DOCKER_TOTAL=$(docker ps -a 2>/dev/null | tail -n +2 | wc -l)
    DOCKER_HEALTHY=$(docker ps 2>/dev/null | grep -c 'healthy' || true)
    DOCKER_UNHEALTHY=$(docker ps 2>/dev/null | grep -c 'unhealthy' || true)
    DOCKER_STOPPED=$(docker ps -a 2>/dev/null | grep -c 'Exited' || true)
    DOCKER_IMAGES=$(docker images -q 2>/dev/null | wc -l)
    DOCKER_VOLUMES=$(docker volume ls -q 2>/dev/null | wc -l)
else
    DOCKER_RUNNING="N/A"; DOCKER_TOTAL="N/A"; DOCKER_HEALTHY="N/A"
    DOCKER_UNHEALTHY="N/A"; DOCKER_STOPPED="N/A"; DOCKER_IMAGES="N/A"
    DOCKER_VOLUMES="N/A"; DOCKER_COLOR="$GRAY"
fi
Docker stats with a graceful fallback if Docker isn't installed. Tracks healthy/unhealthy containers — this is the first thing I check when something feels slow.
# Systemd
FAILED_SVC_COUNT=$(systemctl --failed --no-legend 2>/dev/null | wc -l)
FAILED_SVC_LIST=$(systemctl --failed --no-legend 2>/dev/null | awk '{print $1}' | tr '\n' ', ' | sed 's/,$//')

# Processes
PROCS_TOTAL=$(ps aux --no-heading 2>/dev/null | wc -l)
ZOMBIES=$(ps aux --no-heading 2>/dev/null | awk '$8=="Z"' | wc -l)
Systemd failures and zombie processes. Both are silent killers — services fail silently, zombies accumulate silently.
# Top processes
TOP_CPU=$(ps aux --sort=-%cpu --no-heading 2>/dev/null | head -5 | while read user pid cpu mem vsz rss tty stat start time cmd; do
    printf "<tr><td style='padding:4px 8px;border-bottom:1px solid #eee;font-size:12px;'>%s</td><td style='padding:4px 8px;border-bottom:1px solid #eee;font-size:12px;'>%s%%</td><td style='padding:4px 8px;border-bottom:1px solid #eee;font-size:12px;'>%s%%</td></tr>\n" "$cmd" "$cpu" "$mem"
done)
Top 5 CPU and memory consumers. Helps identify runaway processes without logging into the server.
# Security
SSH_FAILED=$(journalctl -u ssh --since "24 hours ago" --no-pager 2>/dev/null | grep -c "Failed" || true)
ERRORS_1H=$(journalctl -p err --since "1 hour ago" --no-pager 2>/dev/null | wc -l)
ERRORS_24H=$(journalctl -p err --since "24 hours ago" --no-pager 2>/dev/null | wc -l)
OOM_KILLS=$(dmesg 2>/dev/null | grep -c "Out of memory" || true)
Security metrics. SSH brute force detection is critical for VPS — I've seen scripts hammering 24/7.
HTML Email Builder
HTML=""
HTML+="<table>"
HTML+=$(section "SYSTEM")
HTML+=$(row "Hostname" "$MY_HOSTNAME")
HTML+=$(row "OS" "$OS")
HTML+=$(row "Kernel" "$KERNEL")
HTML+=$(row "Uptime" "$UPTIME_STR")
HTML+=$(row "Load (1/5/15m)" "$LOAD_STR" "$LOAD_COLOR")
HTML+=$(row "CPU Cores" "$CORES")
HTML+="</table>"
Builds the email section by section. Each section is a separate <table> for clean visual separation. The full script has sections for System, CPU, Memory, Disk, Network, Docker, Systemd, Processes, Top Consumers, and Security.
Email Delivery
# --- Assemble Full Email ---
EMAIL_SUBJECT="[Health Check] ${MY_HOSTNAME} - $(date '+%Y-%m-%d %H:%M')"

FULL_HTML="<!DOCTYPE html>
<html>
<head>
<meta charset=\"UTF-8\">
<style>
body { font-family: -apple-system, BlinkMacSystemFont, 'Segoe UI', Roboto, sans-serif; margin: 0; padding: 20px; background: #f5f6fa; }
.container { max-width: 600px; margin: 0 auto; background: white; border-radius: 8px; box-shadow: 0 2px 10px rgba(0,0,0,0.1); overflow: hidden; }
.header { background: linear-gradient(135deg, #2c3e50, #3498db); color: white; padding: 20px; text-align: center; }
.header h1 { margin: 0; font-size: 20px; }
.header p { margin: 5px 0 0; opacity: 0.8; font-size: 13px; }
.content { padding: 15px; }
table { width: 100%; border-collapse: collapse; margin-bottom: 15px; }
.footer { text-align: center; padding: 15px; background: #f8f9fa; color: #7f8c8d; font-size: 11px; }
</style>
</head>
<body>
<div class=\"container\">
<div class=\"header\">
<h1>Health Check Report</h1>
<p>${MY_HOSTNAME} | ${REPORT_DATE}</p>
</div>
<div class=\"content\">
${HTML}
</div>
<div class=\"footer\">Generated by healthcheck.sh | ${REPORT_DATE}</div>
</div>
</body>
</html>"
Wraps all the collected metrics in a clean HTML template with gradient header, card-style layout, and footer. The CSS is inline for email client compatibility.
# --- Send Email via curl SMTP ---
TMPFILE=$(mktemp /tmp/hc_email.XXXXXX)
trap "rm -f $TMPFILE" EXIT

{
    printf "From: %s\r\n" "$FROM"
    printf "To: %s\r\n" "$TO"
    printf "Subject: %s\r\n" "$EMAIL_SUBJECT"
    printf "MIME-Version: 1.0\r\n"
    printf "Content-Type: text/html; charset=UTF-8\r\n"
    printf "\r\n"
    printf "%s" "$FULL_HTML"
} > "$TMPFILE"

curl --url "smtp://${SMTP_HOST}:${SMTP_PORT}" \
    --mail-from "$FROM" \
    --mail-rcpt "$TO" \
    -T "$TMPFILE" \
    --insecure 2>/dev/null
Sends via curl SMTP — no dependencies beyond curl. Uses a temp file with cleanup trap. The --insecure flag is for self-signed certs in Docker networks.
Setup Instructions
1. Configure the Script
Edit the configuration block at the top of scripts/healthcheck.sh:
SMTP_HOST="172.19.0.9"       # Your SMTP relay IP
SMTP_PORT="587"              # SMTP port
FROM="[email protected]" # Sender address
TO="[email protected]"           # Recipient address
2. Set Up Cron
# Edit crontab
crontab -e

# Every 6 hours (recommended for most setups)
0 */6 * * * /home/local-machine/monitoring/scripts/healthcheck.sh

# Daily at 8am
0 8 * * * /home/debian/gitlab_repo/monitoring/scripts/healthcheck.sh
3. Test the Script
# Run manually first
/home/local-machine/monitoring/scripts/healthcheck.sh

# Check output
echo "Check your inbox for the health check email"
4. Customize Thresholds
Edit the pct_color and pct_status calls to change warning/critical levels:
# Current CPU thresholds (line 66-67)
CPU_COLOR=$(pct_color "$CPU_USED" "70" "90")    # 70% warn, 90% critical
CPU_STATUS=$(pct_status "$CPU_USED" "70" "90")

# Change to more aggressive thresholds
CPU_COLOR=$(pct_color "$CPU_USED" "50" "70")    # 50% warn, 70% critical
CPU_STATUS=$(pct_status "$CPU_USED" "50" "70")
5. Add Network Interface
Change ens3 to your actual interface:
# Find your interface
ip link show

# Update the script (lines 98-103)
NET_RX=$(ip -s link show YOUR_INTERFACE 2>/dev/null | awk '/RX:/{getline; print $1}' || echo "0")
Complete Script
Here's the full healthcheck.sh:
#!/bin/bash
# Health Check Monitoring Script
# Sends HTML email report via smtp-relay:587

set -euo pipefail

# --- Configuration ---
SMTP_HOST="172.19.0.9"
SMTP_PORT="587"
FROM="[email protected]"
TO="[email protected]"
MY_HOSTNAME=$(hostname -f)
REPORT_DATE=$(date '+%Y-%m-%d %H:%M:%S %Z')

# --- Color Codes ---
GREEN="#2ecc71"
YELLOW="#f39c12"
RED="#e74c3c"
GRAY="#95a5a6"

# --- Helper Functions ---
pct_color() {
    local val=$1 warn=$2 crit=$3
    awk "BEGIN{v=$val; w=$warn; c=$crit; if(v>c) print \"$RED\"; else if(v>w) print \"$YELLOW\"; else print \"$GREEN\"}"
}

pct_status() {
    local val=$1 warn=$2 crit=$3
    awk "BEGIN{v=$val; w=$warn; c=$crit; if(v>c) print \"CRITICAL\"; else if(v>w) print \"WARNING\"; else print \"OK\"}"
}

bytes_human() {
    local b=$1
    awk "BEGIN{b=$b; if(b>1073741824) printf \"%.2f GB\",b/1073741824; else if(b>1048576) printf \"%.2f MB\",b/1048576; else if(b>1024) printf \"%.2f KB\",b/1024; else print b\" B\"}"
}

row() {
    echo "<tr><td style='padding:8px;border-bottom:1px solid #ddd;'>$1</td><td style='padding:8px;border-bottom:1px solid #ddd;color:${3:-$GREEN};font-weight:bold;'>$2</td></tr>"
}

section() {
    echo "<tr><td colspan='2' style='padding:12px 8px 8px;background:#34495e;color:white;font-weight:bold;font-size:14px;border-radius:4px 4px 0 0;'>$1</td></tr>"
}

# --- Collect Metrics ---

# System
UPTIME_STR=$(uptime -p 2>/dev/null || uptime)
LOAD_STR=$(cat /proc/loadavg | awk '{print $1" / "$2" / "$3}')
CORES=$(nproc)
KERNEL=$(uname -r)
OS=$(grep PRETTY_NAME /etc/os-release | cut -d'"' -f2)

# CPU
read CPU_USER CPU_SYS CPU_IDLE CPU_IOW <<< $(top -bn1 | grep "%Cpu" | sed 's/%Cpu(s)://' | awk '{
    for(i=1;i<=NF;i++){
        gsub(/,/,"",$i)
        if($i=="us")u=$(i-1)
        if($i=="sy")s=$(i-1)
        if($i=="id")d=$(i-1)
        if($i=="wa")w=$(i-1)
    }
    printf "%s %s %s %s",u,s,d,w
}')
CPU_USED=$(awk "BEGIN{printf \"%.1f\",100-${CPU_IDLE:-0}}")
CPU_COLOR=$(pct_color "$CPU_USED" "70" "90")
CPU_STATUS=$(pct_status "$CPU_USED" "70" "90")

# Load
LOAD_1=$(echo "$LOAD_STR" | awk -F'/' '{gsub(/ /,"",$1); print $1}')
LOAD_COLOR=$(pct_color "$LOAD_1" "4" "5")

# Memory
MEM_TOTAL=$(free -m | awk '/Mem:/{print $2}')
MEM_USED=$(free -m | awk '/Mem:/{print $3}')
MEM_AVAIL=$(free -m | awk '/Mem:/{print $7}')
MEM_PCT=$(awk "BEGIN{printf \"%.1f\",$MEM_USED*100/$MEM_TOTAL}")
MEM_COLOR=$(pct_color "$MEM_PCT" "75" "90")
MEM_STATUS=$(pct_status "$MEM_PCT" "75" "90")

# Swap
SWAP_TOTAL=$(free -m | awk '/Swap:/{print $2}')
SWAP_USED=$(free -m | awk '/Swap:/{print $3}')
SWAP_PCT=$(awk "BEGIN{if($SWAP_TOTAL>0) printf \"%.1f\",$SWAP_USED*100/$SWAP_TOTAL; else print 0}")
SWAP_COLOR=$(pct_color "$SWAP_PCT" "50" "75")

# Disk
DISK_USED_PCT=$(df / | tail -1 | awk '{gsub(/%/,"",$5); print $5}')
DISK_AVAIL=$(df -h / | tail -1 | awk '{print $4}')
DISK_COLOR=$(pct_color "$DISK_USED_PCT" "75" "90")
DISK_STATUS=$(pct_status "$DISK_USED_PCT" "75" "90")

# Inodes
INODE_USED_PCT=$(df -i / | tail -1 | awk '{gsub(/%/,"",$5); print $5}')
INODE_COLOR=$(pct_color "$INODE_USED_PCT" "75" "90")

# Network
NET_RX=$(ip -s link show ens3 2>/dev/null | awk '/RX:/{getline; print $1}' || echo "0")
NET_TX=$(ip -s link show ens3 2>/dev/null | awk '/TX:/{getline; print $1}' || echo "0")
NET_RX_H=$(bytes_human "$NET_RX")
NET_TX_H=$(bytes_human "$NET_TX")
NET_ERRORS=$(ip -s link show ens3 2>/dev/null | awk '/RX:/{getline; print $3}' || echo "0")
NET_DROPS=$(ip -s link show ens3 2>/dev/null | awk '/RX:/{getline; print $5}' || echo "0")
NET_COLOR=$( [ "$NET_ERRORS" = "0" ] && [ "$NET_DROPS" = "0" ] && echo "$GREEN" || echo "$RED" )

# Open ports
OPEN_PORTS=$(ss -tlnp 2>/dev/null | grep -v '127.0.0.1' | grep -v '::1' | awk '{print $4}' | sed 's/.*://' | sort -un | tr '\n' ', ' | sed 's/,$//')
OPEN_PORTS_COUNT=$(echo "$OPEN_PORTS" | awk -F',' '{print NF}')

# Docker
if command -v docker &>/dev/null; then
    DOCKER_RUNNING=$(docker ps 2>/dev/null | tail -n +2 | wc -l)
    DOCKER_TOTAL=$(docker ps -a 2>/dev/null | tail -n +2 | wc -l)
    DOCKER_HEALTHY=$(docker ps 2>/dev/null | grep -c 'healthy' || true)
    DOCKER_UNHEALTHY=$(docker ps 2>/dev/null | grep -c 'unhealthy' || true)
    DOCKER_STOPPED=$(docker ps -a 2>/dev/null | grep -c 'Exited' || true)
    DOCKER_IMAGES=$(docker images -q 2>/dev/null | wc -l)
    DOCKER_VOLUMES=$(docker volume ls -q 2>/dev/null | wc -l)
    DOCKER_COLOR=$( [ "$DOCKER_UNHEALTHY" = "0" ] && [ "$DOCKER_STOPPED" = "0" ] && echo "$GREEN" || echo "$RED" )
else
    DOCKER_RUNNING="N/A"; DOCKER_TOTAL="N/A"; DOCKER_HEALTHY="N/A"
    DOCKER_UNHEALTHY="N/A"; DOCKER_STOPPED="N/A"; DOCKER_IMAGES="N/A"
    DOCKER_VOLUMES="N/A"; DOCKER_COLOR="$GRAY"
fi

# Systemd
FAILED_SVC_COUNT=$(systemctl --failed --no-legend 2>/dev/null | wc -l)
FAILED_SVC_LIST=$(systemctl --failed --no-legend 2>/dev/null | awk '{print $1}' | tr '\n' ', ' | sed 's/,$//')
SVC_COLOR=$( [ "$FAILED_SVC_COUNT" = "0" ] && echo "$GREEN" || echo "$RED" )

# Processes
PROCS_TOTAL=$(ps aux --no-heading 2>/dev/null | wc -l)
ZOMBIES=$(ps aux --no-heading 2>/dev/null | awk '$8=="Z"' | wc -l)
ZOMBIE_COLOR=$( [ "$ZOMBIES" = "0" ] && echo "$GREEN" || echo "$RED" )

# Top processes
TOP_CPU=$(ps aux --sort=-%cpu --no-heading 2>/dev/null | head -5 | while read user pid cpu mem vsz rss tty stat start time cmd; do
    printf "<tr><td style='padding:4px 8px;border-bottom:1px solid #eee;font-size:12px;'>%s</td><td style='padding:4px 8px;border-bottom:1px solid #eee;font-size:12px;'>%s%%</td><td style='padding:4px 8px;border-bottom:1px solid #eee;font-size:12px;'>%s%%</td></tr>\n" "$cmd" "$cpu" "$mem"
done)

TOP_MEM=$(ps aux --sort=-%mem --no-heading 2>/dev/null | head -5 | while read user pid cpu mem vsz rss tty stat start time cmd; do
    rss_mb=$((rss / 1024))
    printf "<tr><td style='padding:4px 8px;border-bottom:1px solid #eee;font-size:12px;'>%s</td><td style='padding:4px 8px;border-bottom:1px solid #eee;font-size:12px;'>%s%%</td><td style='padding:4px 8px;border-bottom:1px solid #eee;font-size:12px;'>%sMB</td></tr>\n" "$cmd" "$mem" "$rss_mb"
done)

# Security
SSH_FAILED=$(journalctl -u ssh --since "24 hours ago" --no-pager 2>/dev/null | grep -c "Failed" || true)
SSH_COLOR=$(pct_color "$SSH_FAILED" "10" "50")

# Logs
ERRORS_1H=$(journalctl -p err --since "1 hour ago" --no-pager 2>/dev/null | wc -l)
ERRORS_24H=$(journalctl -p err --since "24 hours ago" --no-pager 2>/dev/null | wc -l)
OOM_KILLS=$(dmesg 2>/dev/null | grep -c "Out of memory" || true)
OOM_COLOR=$( [ "$OOM_KILLS" = "0" ] && echo "$GREEN" || echo "$RED" )

# --- Build HTML ---
HTML=""
HTML+="<table>"
HTML+=$(section "SYSTEM")
HTML+=$(row "Hostname" "$MY_HOSTNAME")
HTML+=$(row "OS" "$OS")
HTML+=$(row "Kernel" "$KERNEL")
HTML+=$(row "Uptime" "$UPTIME_STR")
HTML+=$(row "Load (1/5/15m)" "$LOAD_STR" "$LOAD_COLOR")
HTML+=$(row "CPU Cores" "$CORES")
HTML+="</table>"

HTML+="<table>"
HTML+=$(section "CPU")
HTML+=$(row "Usage" "${CPU_USED}%" "$CPU_COLOR")
HTML+=$(row "User / System" "${CPU_USER:-0}% / ${CPU_SYS:-0}%")
HTML+=$(row "I/O Wait" "${CPU_IOW:-0}%")
HTML+=$(row "Status" "$CPU_STATUS" "$CPU_COLOR")
HTML+="</table>"

HTML+="<table>"
HTML+=$(section "MEMORY")
HTML+=$(row "Total / Used / Avail" "${MEM_TOTAL}MB / ${MEM_USED}MB / ${MEM_AVAIL}MB")
HTML+=$(row "Usage" "${MEM_PCT}%" "$MEM_COLOR")
HTML+=$(row "Swap" "${SWAP_USED}MB / ${SWAP_TOTAL}MB (${SWAP_PCT}%)" "$SWAP_COLOR")
HTML+="</table>"

HTML+="<table>"
HTML+=$(section "DISK")
HTML+=$(row "/" "${DISK_USED_PCT}% used, ${DISK_AVAIL} free" "$DISK_COLOR")
HTML+=$(row "Inodes" "${INODE_USED_PCT}%" "$INODE_COLOR")
HTML+="</table>"

HTML+="<table>"
HTML+=$(section "NETWORK (ens3)")
HTML+=$(row "Received" "$NET_RX_H")
HTML+=$(row "Transmitted" "$NET_TX_H")
HTML+=$(row "Errors / Drops" "${NET_ERRORS} / ${NET_DROPS}" "$NET_COLOR")
HTML+=$(row "External Ports" "${OPEN_PORTS_COUNT} (${OPEN_PORTS})")
HTML+="</table>"

HTML+="<table>"
HTML+=$(section "DOCKER")
HTML+=$(row "Containers" "${DOCKER_RUNNING}/${DOCKER_TOTAL} running")
HTML+=$(row "Healthy / Unhealthy" "${DOCKER_HEALTHY} / ${DOCKER_UNHEALTHY}" "$DOCKER_COLOR")
HTML+=$(row "Stopped" "$DOCKER_STOPPED")
HTML+=$(row "Images / Volumes" "${DOCKER_IMAGES} / ${DOCKER_VOLUMES}")
HTML+="</table>"

HTML+="<table>"
HTML+=$(section "SYSTEMD SERVICES")
HTML+=$(row "Failed Units" "$FAILED_SVC_COUNT" "$SVC_COLOR")
if [ "$FAILED_SVC_COUNT" -gt 0 ]; then
    HTML+=$(row "Details" "$FAILED_SVC_LIST" "$RED")
fi
HTML+="</table>"

HTML+="<table>"
HTML+=$(section "PROCESSES")
HTML+=$(row "Total" "$PROCS_TOTAL")
HTML+=$(row "Zombies" "$ZOMBIES" "$ZOMBIE_COLOR")
HTML+="</table>"

HTML+="<table>"
HTML+="<tr><td colspan='3' style='padding:8px;background:#ecf0f1;font-weight:bold;font-size:12px;'>Top 5 CPU</td></tr>"
HTML+="<tr style='background:#f8f9fa;'><td style='padding:4px 8px;font-size:11px;font-weight:bold;'>Process</td><td style='padding:4px 8px;font-size:11px;font-weight:bold;'>CPU%</td><td style='padding:4px 8px;font-size:11px;font-weight:bold;'>MEM%</td></tr>"
HTML+="$TOP_CPU"
HTML+="</table>"

HTML+="<table>"
HTML+="<tr><td colspan='3' style='padding:8px;background:#ecf0f1;font-weight:bold;font-size:12px;'>Top 5 Memory</td></tr>"
HTML+="<tr style='background:#f8f9fa;'><td style='padding:4px 8px;font-size:11px;font-weight:bold;'>Process</td><td style='padding:4px 8px;font-size:11px;font-weight:bold;'>MEM%</td><td style='padding:4px 8px;font-size:11px;font-weight:bold;'>RSS</td></tr>"
HTML+="$TOP_MEM"
HTML+="</table>"

HTML+="<table>"
HTML+=$(section "SECURITY")
HTML+=$(row "SSH Failed (24h)" "$SSH_FAILED" "$SSH_COLOR")
HTML+=$(row "OOM Kills" "$OOM_KILLS" "$OOM_COLOR")
HTML+=$(row "Journal Errors (1h)" "$ERRORS_1H")
HTML+=$(row "Journal Errors (24h)" "$ERRORS_24H")
HTML+="</table>"

# --- Assemble Full Email ---
EMAIL_SUBJECT="[Health Check] ${MY_HOSTNAME} - $(date '+%Y-%m-%d %H:%M')"

FULL_HTML="<!DOCTYPE html>
<html>
<head>
<meta charset=\"UTF-8\">
<style>
body { font-family: -apple-system, BlinkMacSystemFont, 'Segoe UI', Roboto, sans-serif; margin: 0; padding: 20px; background: #f5f6fa; }
.container { max-width: 600px; margin: 0 auto; background: white; border-radius: 8px; box-shadow: 0 2px 10px rgba(0,0,0,0.1); overflow: hidden; }
.header { background: linear-gradient(135deg, #2c3e50, #3498db); color: white; padding: 20px; text-align: center; }
.header h1 { margin: 0; font-size: 20px; }
.header p { margin: 5px 0 0; opacity: 0.8; font-size: 13px; }
.content { padding: 15px; }
table { width: 100%; border-collapse: collapse; margin-bottom: 15px; }
.footer { text-align: center; padding: 15px; background: #f8f9fa; color: #7f8c8d; font-size: 11px; }
</style>
</head>
<body>
<div class=\"container\">
<div class=\"header\">
<h1>Health Check Report</h1>
<p>${MY_HOSTNAME} | ${REPORT_DATE}</p>
</div>
<div class=\"content\">
${HTML}
</div>
<div class=\"footer\">Generated by healthcheck.sh | ${REPORT_DATE}</div>
</div>
</body>
</html>"

# --- Send Email via curl SMTP ---
TMPFILE=$(mktemp /tmp/hc_email.XXXXXX)
trap "rm -f $TMPFILE" EXIT

{
    printf "From: %s\r\n" "$FROM"
    printf "To: %s\r\n" "$TO"
    printf "Subject: %s\r\n" "$EMAIL_SUBJECT"
    printf "MIME-Version: 1.0\r\n"
    printf "Content-Type: text/html; charset=UTF-8\r\n"
    printf "\r\n"
    printf "%s" "$FULL_HTML"
} > "$TMPFILE"

curl --url "smtp://${SMTP_HOST}:${SMTP_PORT}" \
    --mail-from "$FROM" \
    --mail-rcpt "$TO" \
    -T "$TMPFILE" \
    --insecure 2>/dev/null

echo "[$(date)] Health check email sent to ${TO}"
Here's what actually lands in the inbox:
Final Thoughts
This script isn't a replacement for Prometheus/Grafana — it's a complement. Use it for:
- Quick daily checks — glance at your inbox, know your server is alive
- Fallback monitoring — when Grafana is down, this still works
- Non-technical stakeholders — share reports with people who won't log into dashboards
- Audit trail — keep email history for compliance or debugging
The beauty of bash scripts is their simplicity. No agents to install, no databases to maintain, no dashboards to configure. Just a script, cron, and SMTP.