Server's slow. Website's lagging. Is it the application? The database? Or is something eating all the bandwidth?
That question has saved me hours of wild goose chases. And for over five years, one tool has answered it fast: bmon.
It's not flashy. It doesn't have a web dashboard or AI-powered anomaly detection. But every time I SSH into a box and need to see what's happening on the wire right now, bmon is the first thing I type.
And it just got interesting again: after nearly ten years without a release, bmon 5.0 shipped on September 15, 2026. More on that below.
What bmon Is (and Isn't)
bmon (short for Bandwidth Monitor) is a lightweight, terminal-based tool that shows real-time network traffic per interface. Think of it as top for your network cards.
What it does well:
- Real-time RX/TX rates (bits or bytes)
- Per-interface breakdown with graphs
- Scriptable output (ASCII, custom format strings, and JSON as of 5.0)
- Runs on Linux, and builds on macOS and the BSDs (with less detail than on Linux, where it talks to the kernel over Netlink)
What it doesn't do:
- Packet capture and analysis (use
tcpdumporwireshark) - Per-connection or per-IP breakdown (use
iftop) - Long-term historical logging (use
vnstat)
bmon answers one question: How much traffic is flowing through each interface, right now? And it answers that question better than anything else I've found.
A Short History of bmon
bmon has been around longer than most of the tools we compare it with. Here are the milestones worth knowing:
- 2001 — Thomas Graf starts the project (the copyright line begins here).
- 3.3, July 2014 — macOS port.
- 3.5, August 2014 — Coverity-driven fixes and Travis CI support.
- 3.8, July 2015 — Netlink stays enabled even when traffic control (TC) stats are unavailable.
- 3.9, July 2016 — Color support, the ability to reset statistics from the curses UI, and extra IPv6 statistics.
- 4.0, December 2016 — Monotonic clock instead of the realtime clock, default interface selection based on your policy, RX NoHandler stats on Linux, and cleaner ASCII output flushing.
- 2016–2026 — A long quiet stretch. Distros froze at 4.0, which is what
apt, EPEL and Arch still ship today. - 5.0, September 15, 2026 — The big one:
- JSON output module
- Braille-cell graphs in the curses UI
- IPv4/IPv6 addresses in the additional info pane, with
4and6keys to toggle them - Toggle for TC elements (
t) and display filters for TC ingress/egress Ctrl-N/Ctrl-Pto move between elements- Numeric colors allowed in
bmonrc - No more "Really quit?" dialog
- Build fixes for FreeBSD, DragonflyBSD and OpenBSD, plus CI builds on Linux, macOS and FreeBSD
One practical takeaway: everything in this post works on 4.0 unless it's marked 5.0. To get the new features today, you'll build from source.
Installation
Run these in your terminal. Distro packages currently ship 4.0.
# Debian/Ubuntu
sudo apt install bmon

# Fedora
sudo dnf install bmon

# RHEL and derivatives (EPEL)
sudo dnf install epel-release
sudo dnf install bmon

# Arch/Manjaro
sudo pacman -S bmon

# macOS (Homebrew)
brew install bmon
Want 5.0 (JSON output, Braille graphs)? Build from source. Run these in your terminal:
git clone https://github.com/tgraf/bmon.git
cd bmon
sudo apt install build-essential make libconfuse-dev libnl-3-dev libnl-route-3-dev libncurses-dev pkg-config dh-autoreconf
./autogen.sh && ./configure && make && sudo make install
Note that dh-autoreconf is needed for ./autogen.sh. Check the project's release page to confirm which repository is publishing 5.0 tarballs before you clone.
The Interface, Demystified
Run bmon with no arguments and you'll see a curses interface:
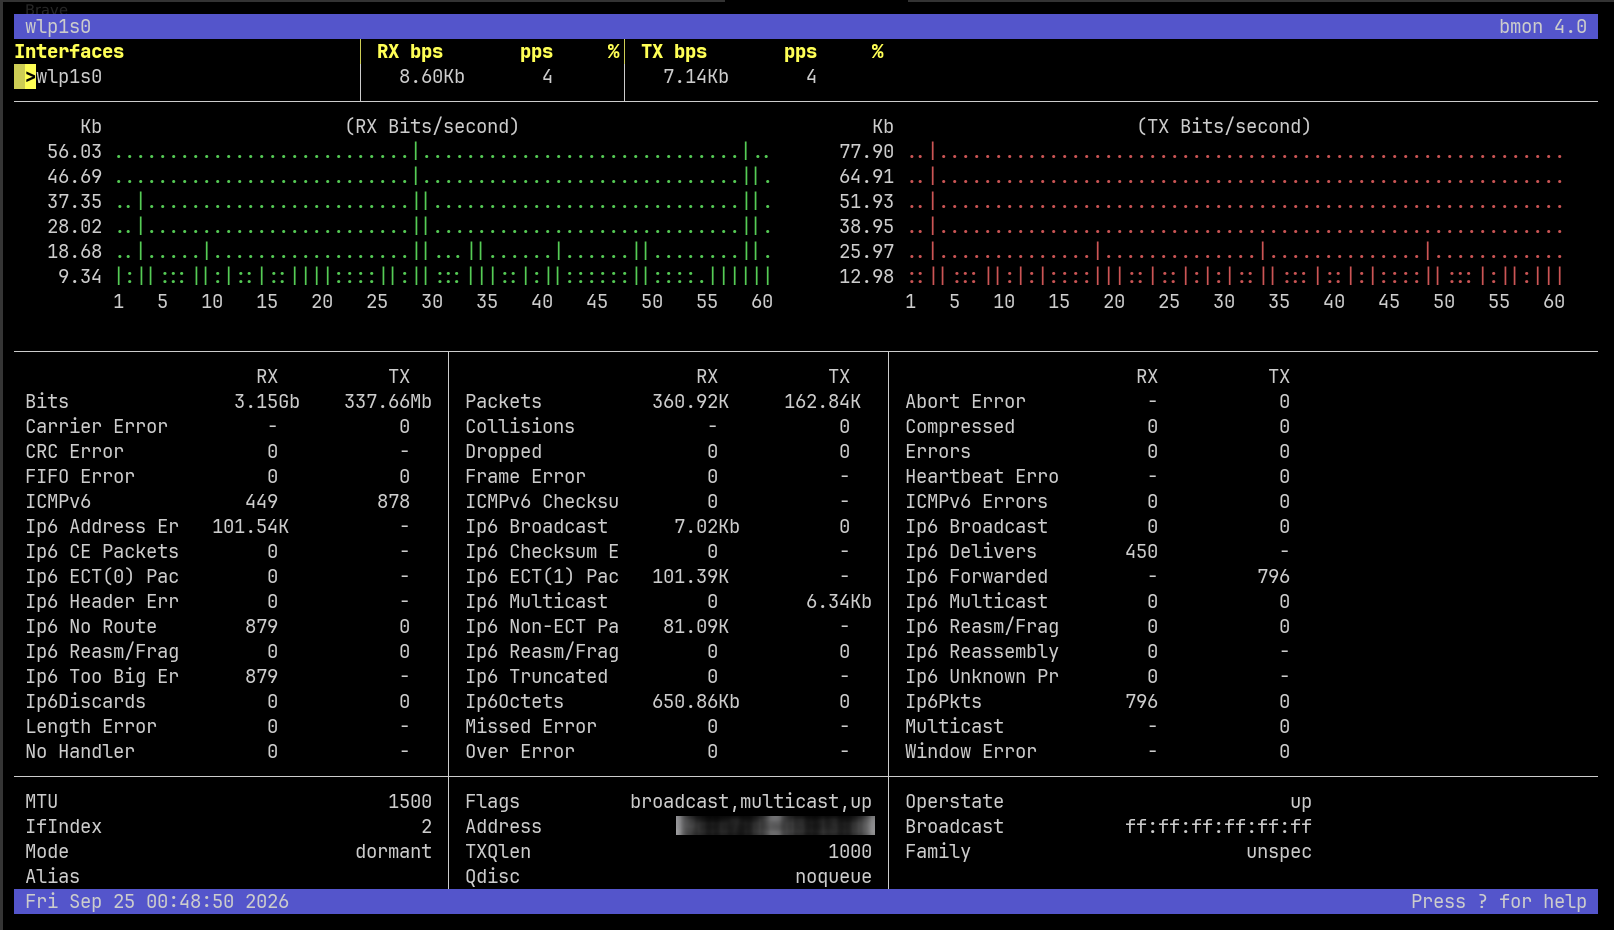
- Interfaces — the list of network interfaces (bmon calls them elements), with RX and TX rates per interface.
- Graphs and detailed stats — the center area shows graphs and counters for the selected interface.
- Help hint — press
?for the quick reference.
Essential Keybindings
| Key | Action |
|---|---|
↑ ↓ |
Select previous/next interface (Ctrl-P/Ctrl-N also work in 5.0) |
← → |
Previous/next attribute (bytes, packets, errors, and so on) |
d |
Toggle detailed statistics |
i |
Toggle additional info |
g |
Toggle graphical statistics |
h |
Start recording history for the selected attribute |
Tab |
Switch the graph's time unit |
< > |
Change the number of graphs |
r |
Reset counters of the selected element |
t, 4, 6 |
5.0: toggle TC elements, IPv4 addresses, IPv6 addresses |
? / q |
Quick reference / quit |
The h key, explained properly
Most people never discover h, and there's a catch: it starts collecting history from that moment. It does not show you traffic from before you pressed it. If you want to catch a spike, press h first, then use Tab to cycle the graph between seconds, minutes, hours and days.
<!-- Screenshot: bmon with history graph enabled showing traffic pattern -->
Tip: bmon's own help screen labels this key H, while the source and the on-screen "Press h to start collecting history" message use lowercase h. Try it on your build.
My Daily bmon Workflow
After five years, I've settled into a few patterns. All of these are terminal commands.
Server Monitoring
bmon -p eth0 -b
That's my default. -p eth0 sets the interface policy to one interface (no scrolling through 20 virtual bridges). -b shows bits instead of bytes, which matches how ISPs and datacenter providers sell bandwidth.
Home Network Debugging
ISP says "up to 500 Mbps." Reality says otherwise. To watch a speed test as it happens:
bmon -p eno1 -b -r 0.5
-r 0.5 reads counters every 500 ms instead of the default 1 second, so the display updates more often. bmon shows what actually crosses your NIC, so it's a good cross-check against the number a speed test reports. If the two disagree by a lot, look for other traffic on the interface (backups, updates, other devices behind the same port) before blaming the ISP.
Development & Deployments
Deployed a new version. Is traffic flowing? Did the service bind correctly?
bmon -p docker0 -b
Watching the default container bridge tells me quickly whether requests are reaching my containers. No logs to tail, no dashboards to open. Docker Compose networks use their own bridges named br-<id>, so run bmon -a first to find the right one.
Quick Server Audit
When I SSH into an unfamiliar box:
bmon -a -b
-a shows all interfaces, including administratively-down ones. Instant overview of what exists and what's active.
Scripting & Automation
bmon isn't just interactive.
ASCII Output
bmon -p eth0 -o ascii -r 5
Prints text stats every 5 seconds. Great for quick checks or redirecting to a file.
Format Strings
bmon -p 'eth*' -o 'format:fmt=$(element:name) RX:$(attr:rxrate:bytes) TX:$(attr:txrate:bytes)\n'
Custom output for awk or your monitoring scripts. Rates are in bytes per second.
One-Shot Snapshot
bmon has no "print once" flag. Instead, output modules take a quitafter option:
bmon -p eth0 -b -o 'ascii:quitafter=2'
Why 2 and not 1? Rates are calculated between samples, so the first block prints zeros. Read the second block. With quitafter=1 the rate columns come back empty; with a higher value, the later blocks show real numbers.
JSON Output (5.0)
bmon -p eth0 -o 'json:quitafter=2'
Machine-readable output for scripts and log shippers, without parsing text tables. This needs a 5.0 build.
bmon vs The Competition
Here's when I reach for each:
| Tool | Best For | Real-time | Per-IP | Historical | Scriptable |
|---|---|---|---|---|---|
| bmon | Per-interface detail + graphs | ✅ | ❌ | Session only | ✅ |
| nload | Quick aggregate bandwidth check | ✅ | ❌ | ❌ | ❌ |
| iftop | Finding which connection is eating bandwidth | ✅ | ✅ | ❌ | Limited (text mode) |
| vnstat | Long-term traffic reports | Live mode | ❌ | ✅ | ✅ |
When to pick bmon:
- You want real-time per-interface stats with visual graphs
- You need scriptable output for automation
- You want something more capable than
nloadwithout going per-connection
When to pick something else:
- Need to know which IP is flooding you? →
iftop - Need monthly traffic reports for billing? →
vnstat - Just want a quick glance at total bandwidth? →
nload
Honestly? I usually have bmon running in one tmux pane and iftop in another. They complement each other.
Pro Tips from 5 Years of Use
Always use -b. Bits mode matches how bandwidth is sold and discussed. Nobody says "I'm getting 60 megabytes per second." They say "500 megabits."
Press h before you need it. History only records from the moment you start it. Start it early on a box you're watching.
Use wildcards for interface selection.
bmon -p 'eth*,wlan*' -b
You can also exclude interfaces with !, for example -p 'eth*,!eth0'.
Combine with tmux for persistent monitoring. Run these in your terminal:
tmux new -s monitor
bmon -p eth0 -b
# Ctrl-B, D to detach
# tmux attach -t monitor to reattach
Running bmon inside tmux means it stays alive even if your SSH session drops.
Tune the rate interval.
bmon -p eth0 -b -R 5
-R sets the window over which rates are calculated. The default is 1 second. Larger values (like 5) give smoother, steadier numbers; keep it at 1 or lower for a twitchy, responsive display. Don't confuse it with -L, the element lifetime, which defaults to 30 seconds.
Conclusion
bmon is old, and it's not trendy. But it's also alive: 5.0 brought JSON output and Braille graphs to a tool many of us assumed was finished.
When I SSH into a box and need to know right now what's happening on the network, I type bmon -p eth0 -b and I have my answer in under a second. No configuration files. No daemons to start.
bmon -p eth0 -b
Try it. You'll probably keep it too.